In the world of finance and investing, there are two primary methods for analyzing securities: fundamental analysis and technical analysis. While fundamental analysis focuses on examining the intrinsic value of an asset based on various factors such as financial statements and economic conditions, technical analysis takes a different approach. It seeks to predict future price movements by analyzing historical market data, primarily through the use of charts, patterns, and indicators. In this blog post, we will delve into the world of technical analysis, exploring its basic assumptions, tools, and limitations.
Table of Contents
What is Technical Analysis?
Technical analysis is a trading discipline that utilizes the analysis of statistical trends derived from trading activity, including price movement and volume, to evaluate investments and uncover potential trading opportunities. In contrast to fundamental analysis, which seeks to assess the intrinsic value of a security by examining business performance indicators such as sales and earnings, technical analysis primarily concentrates on studying the patterns and dynamics of price and volume. By delving into the intricate details of market behavior, technical analysis aims to provide insights into the future direction of securities and facilitate informed decision-making in the realm of trading.

Three Basic Assumptions Behind Technical Analysis
The Market Discounts Itself
Technical analysis operates on the premise that all known information about a security is already reflected in its price. This assumption suggests that fundamental factors, such as financial news or economic reports, are already priced in by market participants. Therefore, technical analysts focus solely on studying price action and market behavior.
Price Moves In a Trend
Technical analysts believe that price movements exhibit trends. These trends can be classified as upward (bullish), downward (bearish), or sideways (consolidation). By identifying and following these trends, technical analysts aim to capitalize on potential opportunities for profit.
History Repeats Itself
Another core assumption of technical analysis is that market patterns and behaviors tend to repeat over time. This belief is based on the idea that human psychology plays a significant role in shaping market dynamics. By studying past price patterns and their subsequent outcomes, technical analysts try to anticipate future price movements.

Six Basic Technical Analysis Tools and Indicators
Candlestick Chart
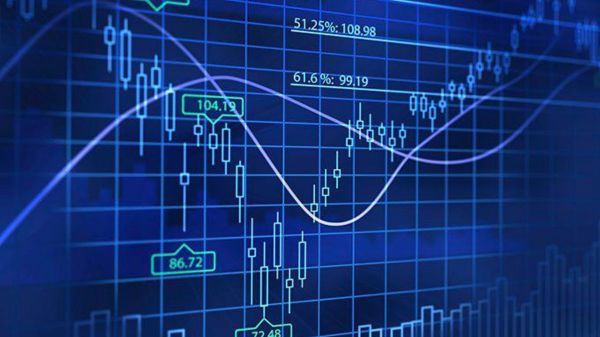
A candlestick chart is a popular tool used in technical analysis to display price data for a given time period. It provides a visual representation of price movement through candlestick-shaped bars. These bars indicate the opening, closing, high, and low prices, allowing analysts to identify patterns and trends.
Support and Resistance
Support and resistance levels are key price levels that technical analysts consider when analyzing a security. Support levels act as a price floor, where buying pressure tends to outweigh selling pressure, preventing prices from falling further. Conversely, resistance levels act as a price ceiling, where selling pressure tends to overpower buying pressure, limiting upward price movement.
Trend Lines
Trend lines are lines drawn on a price chart to connect a series of higher lows (uptrend) or lower highs (downtrend). These lines help identify the direction and strength of a trend. Technical analysts often use trend lines to make predictions about future price movements and determine potential entry and exit points.
Moving Average
A moving average is a widely used technical indicator that smoothes out price data by calculating the average price over a specified period. It helps filter out short-term fluctuations and provides a clearer view of the underlying trend. Traders often use moving averages to identify support and resistance levels or generate buy and sell signals.
Relative Strength Index (RSI)
The Relative Strength Index (RSI) is a momentum oscillator that measures the speed and change of price movements. It oscillates between 0 and 100 and helps identify overbought and oversold conditions in a security. Traders use the RSI to gauge the strength of a trend and potential reversal points.
Bollinger Bands
Bollinger Bands consist of a middle band, typically a moving average, and two outer bands that represent the standard deviation of price movements. These bands expand and contract based on volatility. Traders use Bollinger Bands to identify periods of high or low volatility and potential price breakouts.

How to use technical analysis to trade?
Using technical analysis to trade involves analyzing historical price data, charts, and patterns to make predictions about future price movements in financial markets, including cryptocurrencies. Here are the key steps to use technical analysis effectively in your trading:
- Understand Technical Indicators: Familiarize yourself with various technical indicators such as moving averages, Relative Strength Index (RSI), MACD (Moving Average Convergence Divergence), Bollinger Bands, and more. Each indicator provides insights into different aspects of price movements.
- Study Chart Patterns: Learn to identify common chart patterns such as support and resistance levels, trendlines, head and shoulders, double tops, and double bottoms. Chart patterns can signal potential trend reversals or continuations.
- Choose a Timeframe: Select a timeframe that aligns with your trading strategy. Short-term traders may use lower timeframes (e.g., minutes or hours), while long-term investors may analyze daily or weekly charts.
- Identify Trends: Determine the prevailing trend in the market by analyzing price movements. Trends can be upward (bullish), downward (bearish), or sideways (consolidation).
- Use Multiple Indicators: Combine multiple technical indicators to gain more comprehensive insights. Using a mix of indicators can help confirm signals and reduce false positives.
- Risk Management: Implement proper risk management strategies. Set stop-loss and take-profit levels to limit potential losses and lock in profits when trades go in your favor.
- Backtesting: Test your technical analysis strategies on historical price data to evaluate their effectiveness. Backtesting allows you to refine your approach and gain confidence in your trading plan.
- Stay Informed: Keep yourself updated with the latest news, market sentiment, and fundamental developments that may impact the assets you are trading. Fundamental factors can influence price movements alongside technical patterns.
- Avoid Emotional Trading: Stick to your trading plan and avoid making impulsive decisions based on emotions. Let your technical analysis guide your trading decisions, not fear or greed.
- Continuous Learning: Technical analysis is a skill that requires continuous learning and improvement. Stay open to learning new techniques, strategies, and adapting to changing market conditions.
It's important to note that while technical analysis can be a valuable tool, it is not foolproof, and no trading strategy guarantees profits. The cryptocurrency market can be highly volatile and influenced by various factors, including news events and market sentiment. Always conduct thorough research, understand the risks involved, and only invest what you can afford to lose.
If you are new to trading or unsure about technical analysis, consider starting with a demo account or seeking guidance from experienced traders or financial advisors. Gradually gain experience and confidence before venturing into live trading with real funds.
Limitations of Technical Analysis
Subjectivity
Technical analysis heavily relies on interpretation and subjective judgments. Different analysts may draw different conclusions from the same price data, leading to a lack of consensus.
Inefficiency in Efficient Markets
Efficient markets, where all available information is quickly reflected in prices, can render technical analysis less effective. In such markets, it becomes challenging to gain a competitive edge solely through technical analysis.
Ignoring Fundamental Factors
Technical analysis disregards fundamental factors, such as company financials or macroeconomic indicators. Ignoring these factors can lead to incomplete analysis and missed opportunities.
Historical Data Limitations
Technical analysis relies on historical price data, assuming that patterns will repeat. However, market dynamics and conditions can change, rendering historical patterns less reliable.
Technical analysis provides traders and investors with a framework for predicting future price movements based on historical market data. By understanding its basic assumptions, tools, and limitations, individuals can make informed decisions when incorporating technical analysis into their investment strategies. While technical analysis can offer valuable insights, it is important to combine it with other forms of analysis and consider the broader market context for a comprehensive understanding of the securities being analyzed. Follow https://uniultra.xyz/ for more blockchain updates.


